Pulse
A deployment observability dashboard — real-time uptime, response times, and error rates across every monitored service, plus deploy history and incident tracking in one place.
Key Features
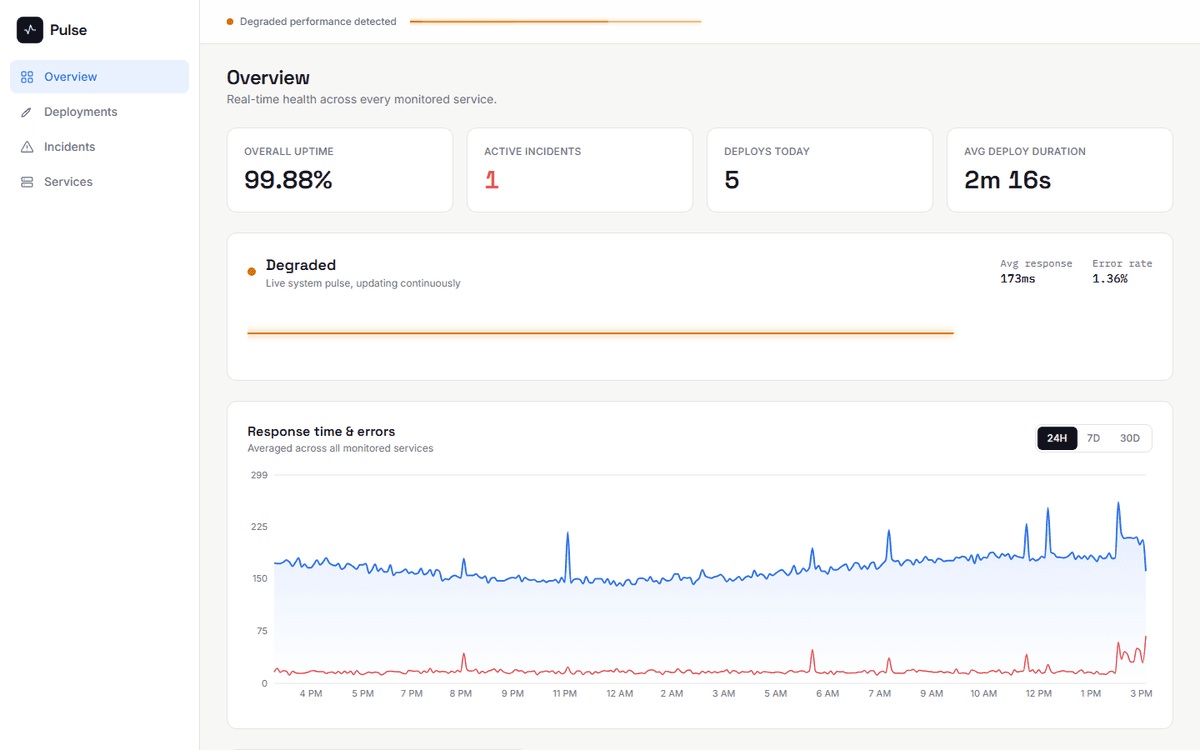
Real-Time Health Feed
Live-updating uptime, error rate, and response time across all monitored services
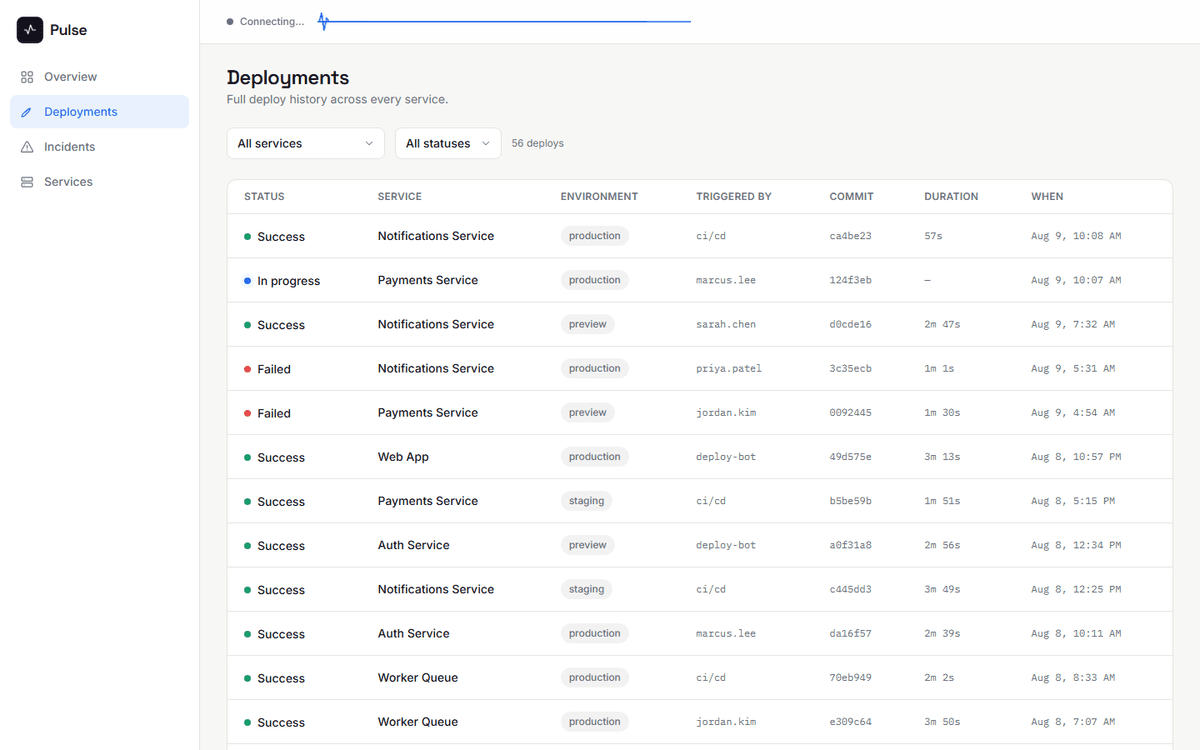
Deployment History
Full deploy log with status, environment, commit hash, and duration
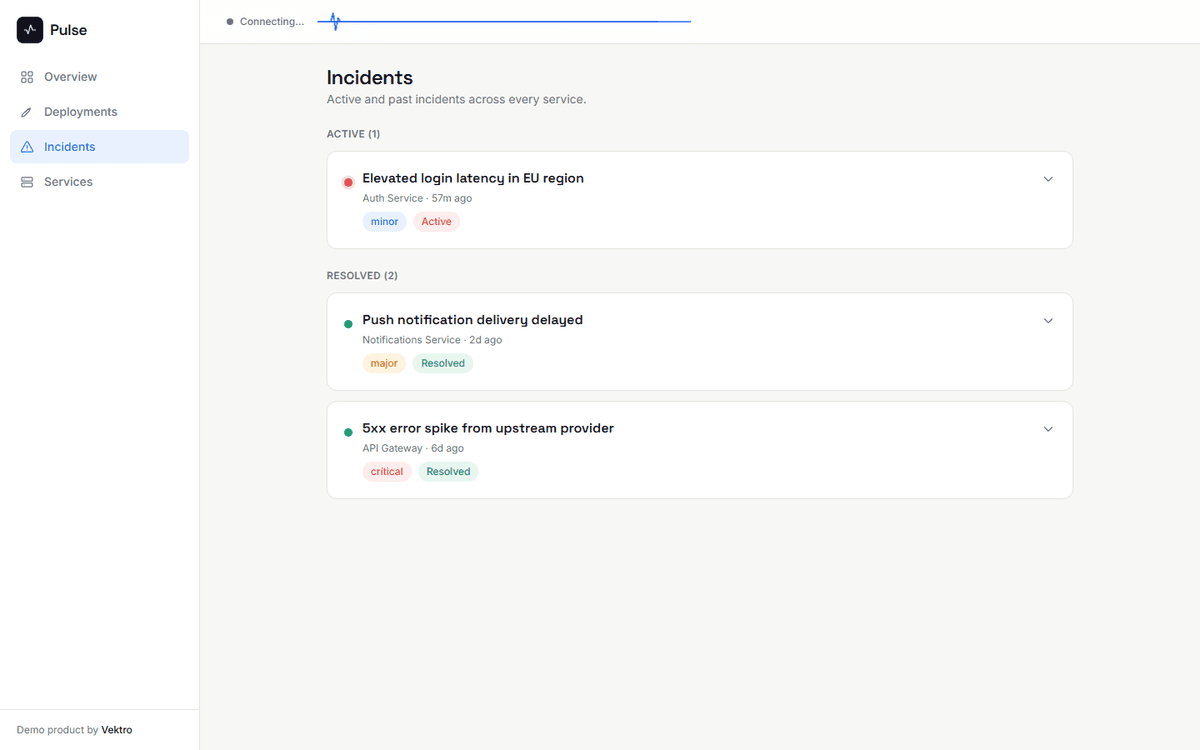
Incident Tracking
Active and resolved incidents grouped by severity, tied to the affected service
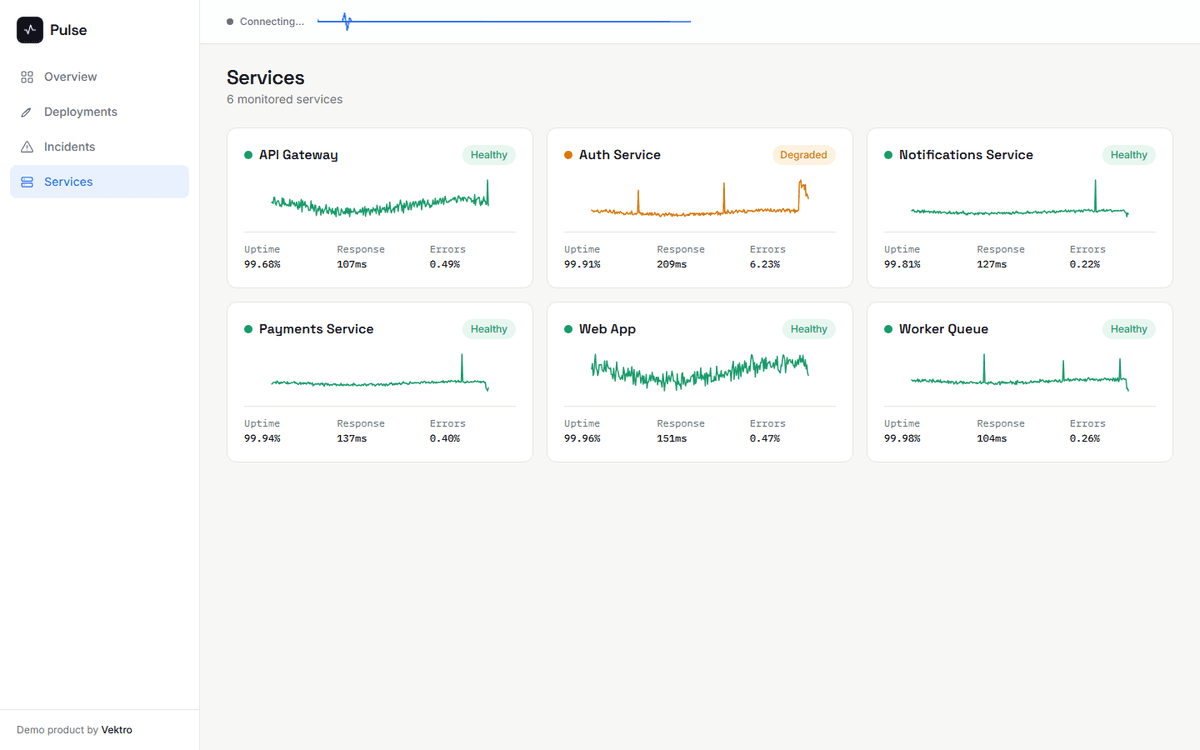
Per-Service Metrics
Uptime, response time, and error rate broken out per service with live sparklines
Response Time & Error Charts
24H / 7D / 30D views averaged across every monitored service
Status-Driven UI
Healthy, degraded, and incident states reflected instantly across the whole dashboard
Technology Stack
Platform Overview
Overview Dashboard
Live uptime, active incidents, deploy count, and a real-time response-time/error chart
Deployment History
Full deploy log across every service — status, environment, commit, and duration
Service Health Grid
Per-service uptime, response time, and error rate with live status indicators
Incident Tracking
Active and resolved incidents grouped by severity, with time-since and affected service